Quickstart for beginners
2020-09-15
Amo (AmoAi V2.7.5) is a computational platform for analyses of bioligical data and applications in bioengineering. This tutorial provides its principles, architecture, and usage for users.
This tutorials of web-servers (under AmoAi) are presented, and those web-servers include: (1) protein sequence analysis & design, (2) protein folding, (3) protein design, (4) structural informatics, and (5) data analysis & visualization.
1. Protein sequence analysis & design
1.1 Overview
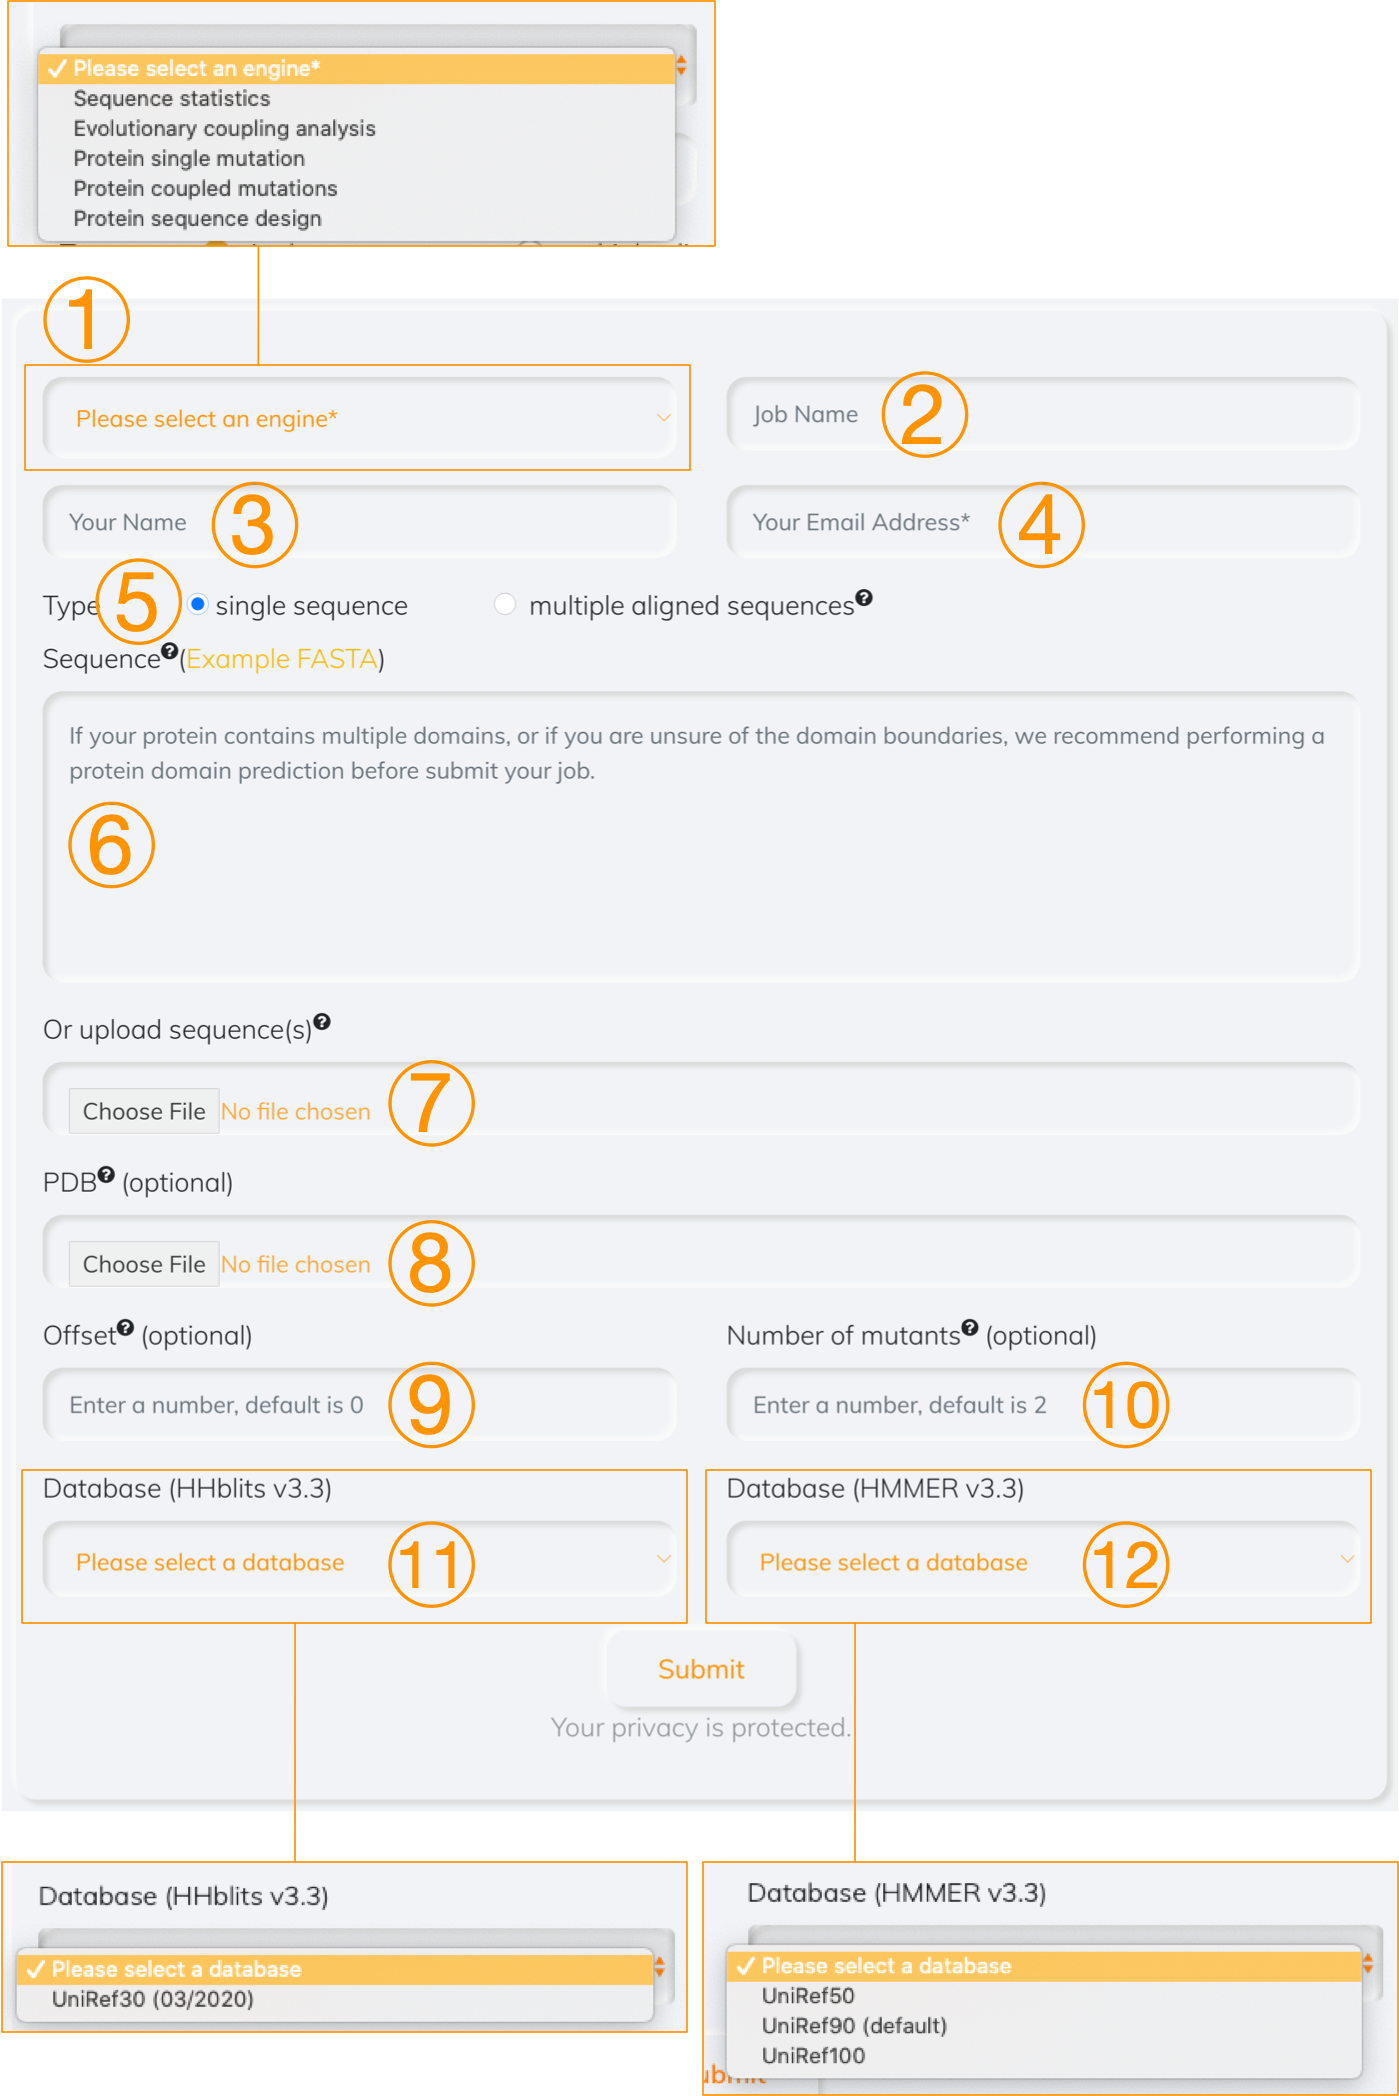
Figure 1. Overview
- Choose which computational tool to use
- Enter a job name (optional)
- Enter your name (optional)
- Enter your email address (required), a notice email will be sent to this address when job is completed
- Select the type of a given file. If the option of multiple aligned sequence is chosen, all analyses are based on the user-defined sequences. Otherwise, a multiple sequence alignment is achived by searching a single sequence provided by user against the database if the option of single sequence is selected
- Paste the sequence profile (in FASTA format)
- Upload the sequence profile (in FASTA format)
- Upload the associated PDB (optional). The inferred residue communities are mapped to the tertiary structure if the PDB is provided
- Offset (optional), set it if the starting index of the first amino acid is not 0
- Numer of mutants (optional). It is used to set the number of mutations that can be mutated together
- Database (optional), it is searched the given sequence against by HHblits tool
- Database (optional), it is searched the given sequence against by HMMER tool
1.2 Protein sequence statistics
Figure 2. Distribution of similarities between pairwise sequences.
Figure 3. Degree of conservation at each single site (not included gaps).
In the calculations, the distribution of similarities between pairwise sequences is computed from a generated multiple sequence alignment (MSA) of a given protein (Figure 2). The degree of conservation at each position (not include the gaps) in the MSA is measured by relative entropy (Figure 3), and it is to indicate how much an amino acid at a specific position could be conserved. The degree of conservation can also how an amino acid at an evolutionarily conserved position is relavent to functionally important sites of protein, moreover, mutations in these positions could be harmful to protein function.
1.3 Evolutionary coupling signatures inferred from sequences
Figure 4. Residue communities of amino acids with both positive and negative interactions.
Figure 5. Residue communities of amino acids.
The coupled interactions between pairwise amino acids of the protein are analyzed by spectrum analysis and ranked by the eigenvalues. The reduced matrix of interactions are achived (Figure 4). In order to look into the networks of residues that play important roles in protein function, the residue communities are defined based on the eigenvalues and preserve the positive interactions among amino acids (Figure 5).
1.4 Protein single mutation
Figure 6. Complete single mutagenesis.
Complete single mutagenesis. The matrix that is computed by the SAEC method shows ΔE — the energy difference of each mutant sequence with each mutation τ at the ith site and wild-type sequence, negative values representing favourable while positive representing unfavourable mutations.
1.5 Protein coupled mutations
Figure 7. Energy differences between the WT and mutant sequence (best-so-far) for the rational protein design in silico.
Based on the best-so-far sequence (designed), one can conduct a signle or multiple (coupled) mutants on the WT sequence, and the energy of the mutant sequence is computed for evaluating the mutant(s). As an example (Figure 7), each two amino acids are combined to be mutated together and the energy differences are to measure quanlity of the coupled mutants.
1.6 Protein sequence design
Figure 8. Sequence energy trajectory of rational protein design in silico.
The energy trajectories of designing the sequence from the WT sequence as shown in the Figure 8, and the WT and mutant sequences are listed below.
WT sequence (energy: -147.990): 123456789|123456789|123456789|123456789|123456789|123 VCSEQAETGPCRAMISRWYFDVTEGKCAPFFYGGCGGNRNNFDTEEYCMAVCGMutant sequence (best-so-far, energy: -167.354): 123456789|123456789|123456789|123456789|123456789|123 VCSEPAETGPCRAMISRWYYDPKTGKCEPFLYSGCGGNGNNFETKEECEETCK